GMAG

Ground-based magnetometer package
Arrays
Stations
Examples
GMAG Examples
A few simple example of loading and plotting ground-based magnetometer data using the GMAG module.
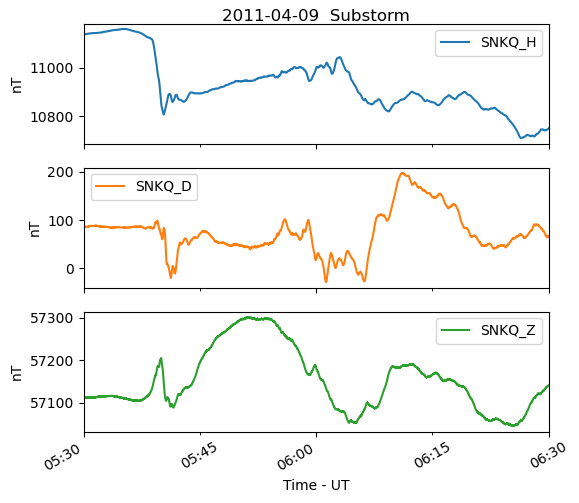
Single Station Plot
Create a single station plot using from data loaded using the themis module.
# Plot a simple time series from
# a single station loaded using
# the THEMIS module

# import required modules
import numpy as np
import matplotlib.pyplot as plt
import gmag.arrays.themis as themis

# define start and end dates for plotting
sdate = '2011-04-09 05:30:00'
edate = '2011-04-09 06:30:00'

# load data
th_dat, th_meta = themis.load(['SNKQ'],sdate,ndays=1)

# plot all data in the DataFrame between
# sdate and edate
th_dat[sdate:edate].plot(ylabel='nT', xlabel='Time - UT', figsize=[6,6],subplots=True)
plt.title(sdate[0:11]+' Substorm',y=3.35)
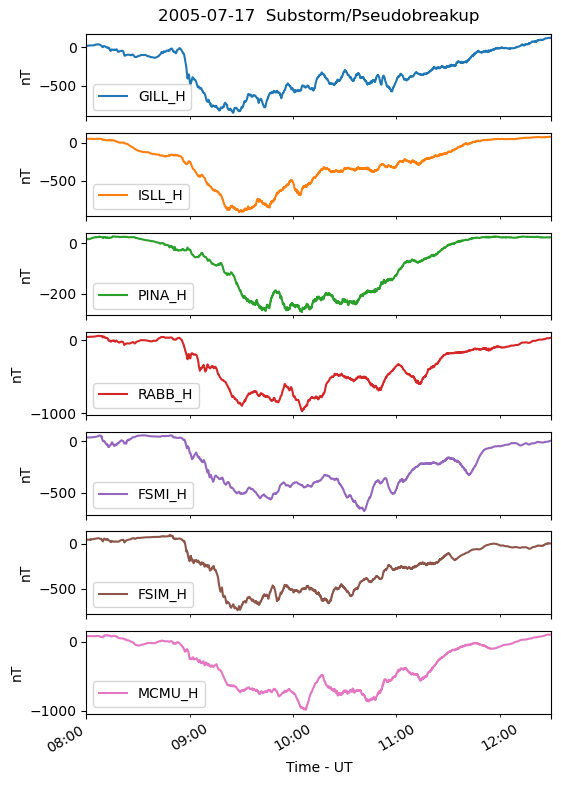
Multi-Panel Plot
Create a multi-panel plot of the H component magnetic field from select CARISMA magnetometer stations using the carisma module.
# Plot multi-panel plot of the H compoment
# magnetic field for select CARSIMA stations

# import required modules
import gmag.arrays.carisma as carisma
import numpy as np
import matplotlib.pyplot as plt

# define start and end date for plotting and loading
# assume a single day is loaded
sdate = '2005-07-17 08:00:00'
edate = '2005-07-17 12:30:00'

# define component to be plotted
comp='H'

# load data
car_dat, car_meta=carisma.load(['GILL','ISLL','PINA','RABB','FSMI','FSIM','MCMU'],sdate)

# find the correct columns of the DataFrame
p_col = [col for col in car_dat.columns if col[-1] == comp]

# plot the DataFrame between sdate and edate
# plot only p_col columns and subtrac the mean from each column
# before plotting
car_dat[sdate:edate][p_col].subtract(car_dat[p_col].mean()).plot(ylabel='nT', xlabel='Time - UT',
                                                            figsize=[6,10],subplots=True)
plt.title(sdate[0:11]+' Substorm/Pseudobreakup',y=8.25)
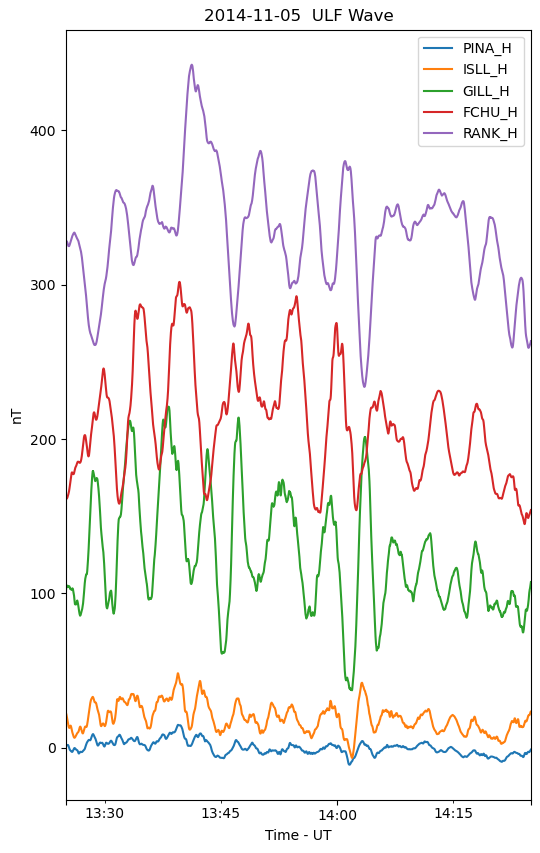
Multi-Station Stacked Plot
Create a single panel stacked plot of the H component magnetic field from CARISMA stations apart of the Churchill line.
# plot a stacked plot of CARISMA the H component
# magnetic field for stations along the Churchill line

# import required modules
import gmag.arrays.carisma as carisma
import numpy as np
import matplotlib.pyplot as plt

# define start and end date for plotting
# use start date for loading data
sdate = '2014-11-05 13:25:00'
edate = '2014-11-05 14:25:00'

# define component for plotting
comp='H'

# load data
car_dat, car_meta=carisma.load(['PINA','ISLL','GILL','FCHU','RANK'],sdate)

# find the columns from the loaded DataFrame that have comp
# in the title, these are the columns that will be plotted
p_col = [col for col in car_dat.columns if col[-1] == comp]

# determine the shift to apply to each time series so that they don't
# overlatp

# the shift is determined using the DataFrame returned by the describe()
# method which stores the DataFrame stats including max and min of each column
# only use columns from p_col and values between the start and end of plotting
# defined by sdate and edate
# the shift in the y direction is defined by 1.5 times the range of the series
y_shift = np.array([(val['max']-val['min'])/1.5 for col_h, val in car_dat[sdate:edate][p_col].describe().iteritems()])

# the cumsum() method determines the cumalitative sum up
# to each index
# the cumsum() ensures timeseries don't overlap
y_shift = (y_shift-y_shift.min()).cumsum()

# plot p_col columns of the data frame between sdate and edate
# subtract the mean from each time series and apply the y-shit
car_dat[sdate:edate][p_col].subtract(car_dat[sdate:edate][p_col].mean()-y_shift).plot(ylabel='nT', xlabel='Time - UT',
                                                            figsize=[6,10])
plt.title(sdate[0:11]+' ULF Wave')
Identify and Loading Data from Stations within a Fixed Region
import pandas as pd
from gmag import utils
import gmag.arrays.carisma as carisma
import gmag.arrays.image as image
import gmag.arrays.themis as themis

#find all stations between 18-24 MLT
#and L shells 6-8 during an event observed
#on 2018-01-01/04:00:00 UT

#set time period and
#location of interest
date = pd.to_datetime('2018-01-01/04:00:00')

mlt_min = 18
mlt_max = 24
l_min = 6
l_max = 8

#load all stations
all_stn = utils.load_station_coor(param='*', year=date.year)

#calculate the MLT of the stations for the date
#the MLT at 0 UT is stored in the mlt_ut column
#mlt for the date of interest is then mlt at 0 UT
#plus current UT
all_stn['mlt'] = (all_stn['mlt_ut']+date.hour) % 24

#create masks for the mlt and lshell regions
mlt_mask = (all_stn['mlt'] >= mlt_min) & (all_stn['mlt'] <= mlt_max)
l_mask = (all_stn['lshell'] >= l_min) & (all_stn['lshell'] <= l_max)

#create masks for the arrays
car_mask = all_stn['array'] == 'CARISMA'
img_mask = all_stn['array'] == 'IMAGE'

#identify stations from each array
#carisma stations and image stations
car_stn = all_stn[car_mask & mlt_mask & l_mask]
img_stn = all_stn[img_mask & mlt_mask & l_mask]
#themis stations the ~ is bitwise negation, in this case
#stations that aren't apart of image or carisma (1 if 0, 0 if 1)
thm_stn = all_stn[~img_mask & ~car_mask & mlt_mask & l_mask]

#create an empty DataFrames for all
#loaded data and metadata
mag_meta = pd.DataFrame()
mag_data = pd.DataFrame()

#loop through stations DataFrames
#to load data for each array
for stn in [car_stn,img_stn,thm_stn]:
    #skip if no stations were
    #identified
    if stn.shape[0] == 0:
        continue
    elif stn['array'].iloc[0] == 'CARISMA':
        l_dat, l_meta = carisma.load(car_stn['code'],date,ndays=1,drop_flag=True)
    elif stn['array'].iloc[0] == 'IMAGE':
        l_dat, l_meta = image.load(img_stn['code'],date,ndays=1,drop_flag=True)
    else:
        l_dat, l_meta = themis.load(thm_stn['code'],date,ndays=1)

    # add loaded data to
    mag_data = mag_data.join(l_dat,how='outer')
    mag_meta = pd.concat([mag_meta,l_meta], axis=0, sort=False, ignore_index=True)